Medicine in 3-D
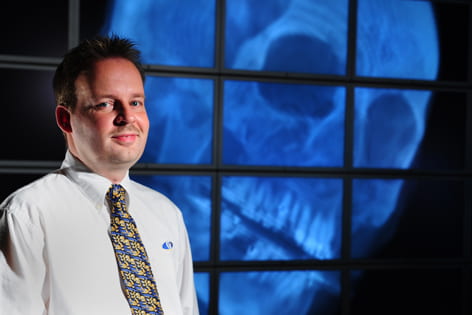
Researchers at UC Irvine’s California Institute for Telecommunications & Information Technology have developed a new way to transform enormous medical datasets into rotating, three-dimensional images, vastly increasing the potential of the institute’s 200-megapixel display HIPerWall.

Researchers at UC Irvine’s California Institute for Telecommunications & Information Technology have developed a new way to transform enormous medical datasets into rotating, three-dimensional images, vastly increasing the potential of the institute’s 200-megapixel display HIPerWall.
Scientists invented breakthrough software that can display CT scans and other internal images from the human body in three dimensions, transforming the room-sized visualization wall into what they believe is the world’s largest medical display. The software’s key improvement is that radiologists can change tissue image transparency and color for teaching and diagnosis.
“We can make the skin and brain transparent so we can see a tumor, or we can make blood vessels light up in a certain color,” says Joerg Meyer, UCI professor of electrical engineering & computer science.
“In the past, user interfaces were mainly designed by computer scientists dealing with abstract numbers. We made the user interface relevant to radiologists and biologists by giving them a tool that automatically finds clusters in data and suggests tissue-specific transparencies and colors.”
HIPerWall, a tiled display of 50 computer screens, allows scientists to view and manipulate huge datasets in extremely high definition. It has been displaying two-dimensional images and video since 2005, and now it can provide 400 megavoxels in full 3-D, rotating images to give scientists high-resolution views from all angles.
Meyer led the effort to design software that incorporates voxels – volume elements – into the display wall’s capabilities. A voxel is in 3-D what a pixel is in 2-D.
Dividing 3-D Space
The task was daunting. The software had to be written so that each computer could process and render a small piece of the total image. This undertaking, relatively simple in two dimensions, becomes much more complicated in three.
“When you’re working with a two-dimensional image, you just cut the image into tiles and each computer needs access only to the part of the dataset it will display,” Meyer says. But in three dimensions, the image rotates, and its individual pieces will likely move from one screen to another, requiring data to move between computers.
The solution involved meshing two key technologies. The first, “octtree subdivision,” results in tiny “bricks” of information that are easier to manage and can move from one computer to another. The second, more important technology is “wavelet decomposition,” a process that breaks down details in images, stores them in separate files and renders data at different resolutions. This technique keeps computers from slowing down as they process massive datasets that can be at least as large as a hard drive on an average desktop computer.
Octtree and wavelet techniques each are routinely used in other applications, but they provide a one-of-a-kind software backbone when they’re combined.
“The combination of octtree and wavelet together is a unique technology that allows us to render large medical data sets in real time,” Meyer says. “We are very excited about this accomplishment.”
Branching Out
The software is opening new doors in research as well as medicine. When Meyer recently introduced it to biomedical engineering faculty, it attracted interest from several colleagues who are employing it on HIPerWall for their research. One project examines collagen fibers to determine their role in corneal deformities; a second studies plaque deposits in mouse blood vessels; and the third scrutinizes the relationship between bone density and the success of dental implants.
Meyer also sees potential applications in civil engineering. “For us, an earthquake model with different layers of soil stacked on top of each other is exactly the same as CT data,” he says.
The team, which includes graduate students Sebastian Thelen and Li-Chang Cheng, draws on CGLX and other visualization frameworks developed by researchers Falko Kuester and Kai Doerr at Calit2 UCSD, and Stephen Jenks and Sung-Jin Kim at Calit2 UCI. The group intends to keep working on the software to make it more user-friendly and to improve speed, visual quality, color schemes and adaptability.
